A Single Source of Truth.
A single Purpose Workspace with role-based views ensuring you have governance, controls over your ESG data with a comprehensive view of your landscape and progress.
- Unified data across all ESG initiatives
- Granular workflow and access controls by role, team
- Real-time impact collaboration with audit trails
Financial & Operational Tracking
LiveBudget Utilization
78%
Beneficiaries
12,450
+23% this quarter
24
Active Projects
8
Regions
100%
Compliant
AI-Powered
AI-Powered Benchmarking.
Save months of manual research. Compare your initiatives against global best practices instantly.
Community Impact — Peer Benchmarking
5 entities · 9 metrics| Metric | Peer 1 | Peer 2 | Competitor 1 | Competitor 2 | Average |
|---|---|---|---|---|---|
| Total Employee Volunteering Hours | 317,000 | 185,000 | 224,000 | 412,000 | 284,500 |
| Volunteering Hours per Employee | 8.50 | 4.20 | 6.10 | 12.30 | 7.80 |
| Employee Donations with Matching (USD M) | 45.20 | 28.50 | 62 | 38.70 | 43.60 |
| Employees in Community Programs (%) | 42 | 35 | 58 | 28 | 40.80 |
| Donation Matching Ratio | 1.50 | 1 | 2 | 1.25 | 1.44 |
| Community Investment (% of Revenue) | 0.15 | 0.08 | 0.22 | 0.10 | 0.14 |
| Total Cash & In-Kind Contributions (USD M) | 125 | 440 | 85 | 220 | 217.50 |
| Total Grants Provided (USD M) | 135 | 48 | 92 | 210 | 121.30 |
| Employee Participation Rate (%) | 62 | 45 | 53 | 71 | 57.80 |
Heatmap
HighAbove AvgAverageBelow AvgLow
Purpose Impact Map
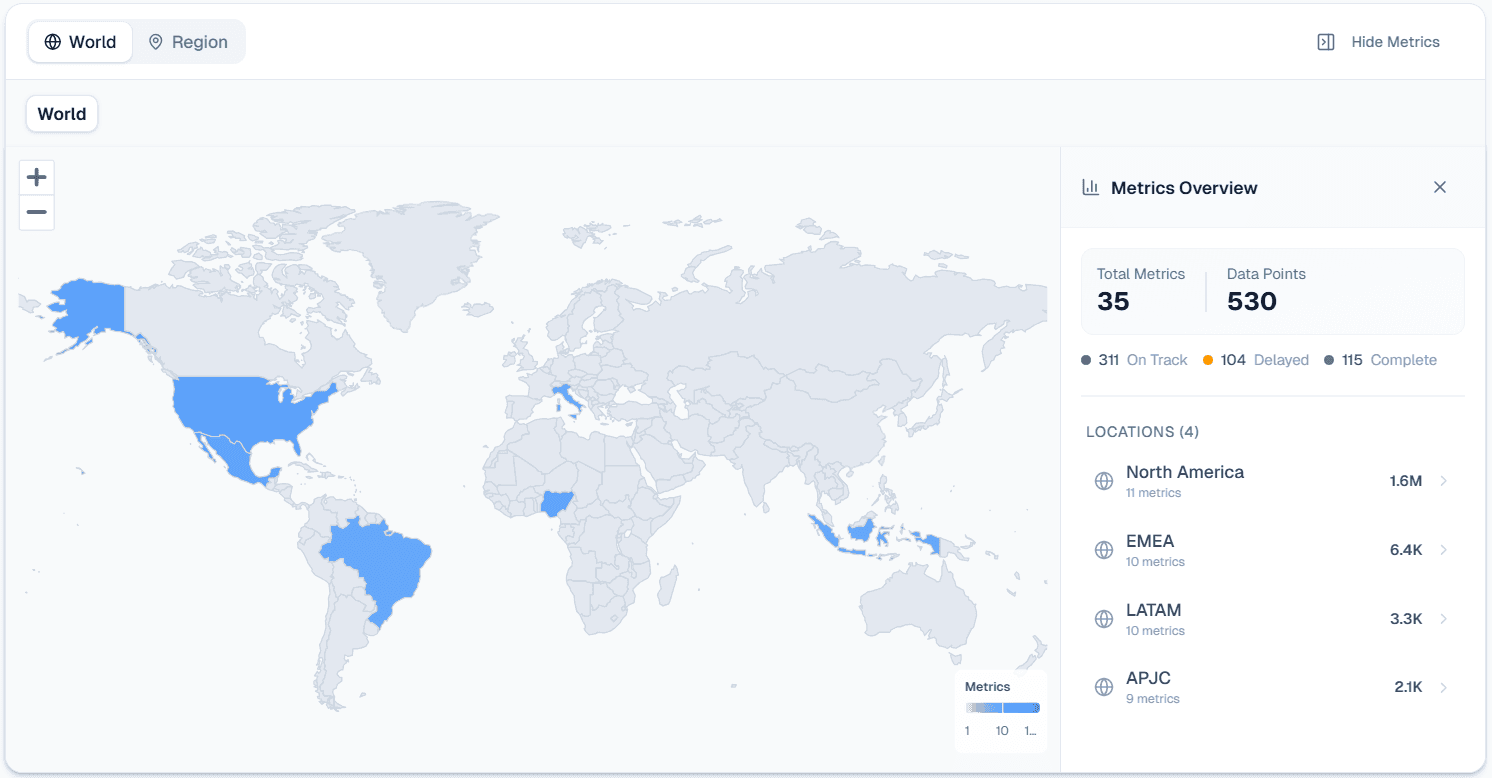
Purpose Proximity
Visualize Your Impact Footprint.
Searchable drill-down interactive maps showing impact by location, initiative and beneficiary. Understand and assess your global impact reach at a glance
- Filter by geography, initiative, metrics, outcomes
- Drill-down to beneficiary level insights
- Export visualizations for stakeholder reporting
- Capture actions and impacts across your entire value and supply chains